



Smoothie Charts
A lightweight JavaScript charting library for real-time streaming data visualization, ideal for monitoring and analytics.
Score
30
User Rating
3.0
Free/Trial Support
Supported
Starting Price
--
Last Updated
Aug 04, 2026
Overview
What is Smoothie Charts?
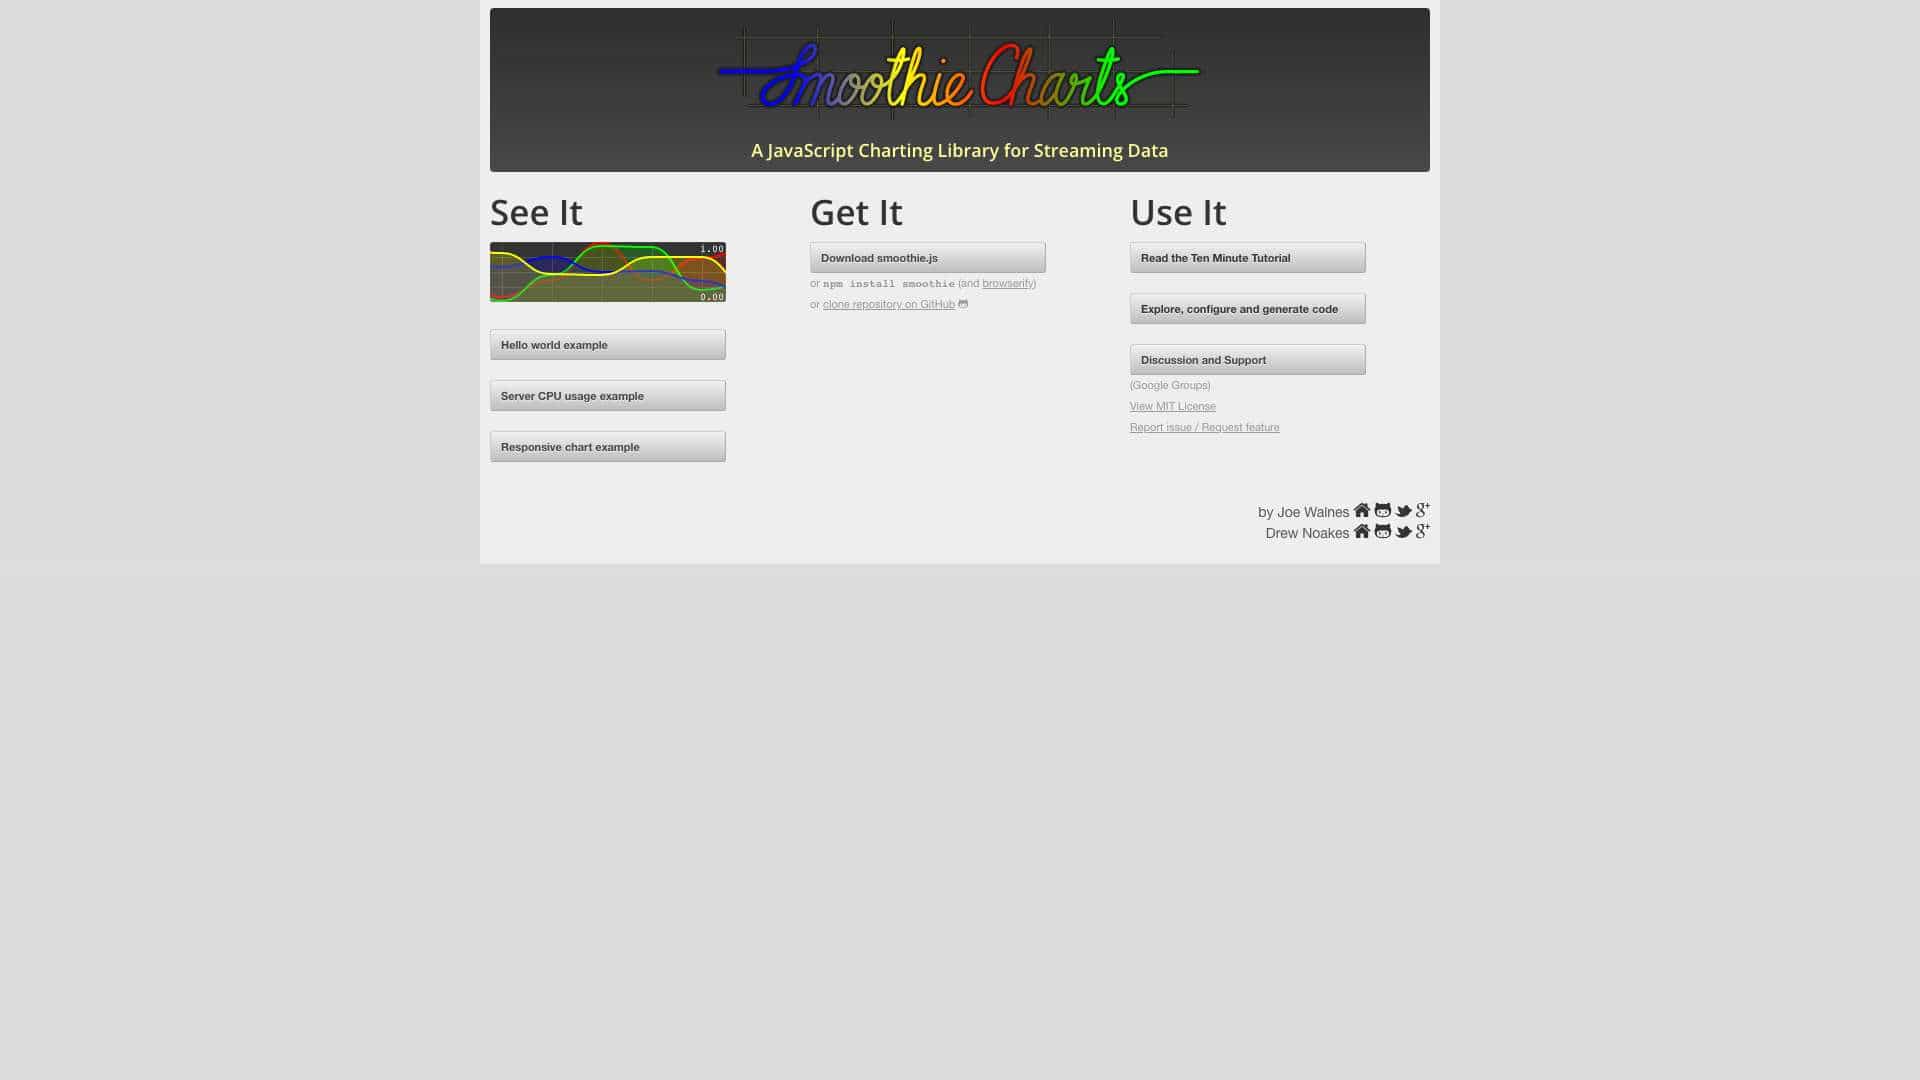
Smoothie Charts is a JavaScript library designed for creating smooth, real-time charts that update continuously with streaming data, such as server metrics or live feeds.
What is Smoothie Charts used for?
Top Features
- Real-time streaming data support
- Lightweight and fast
- Customizable chart options
- Responsive design
- MIT licensed
How to use Smoothie Charts?
Download smoothie.js via npm or direct download, include it in your web project, and use the API to configure and render charts based on streaming data inputs.
Alternative Tools
No alternative tools found
Pros & Cons
Pros
- Easy to integrate
- Good performance for live data
- Open source and free
- Active community support
Cons
- Limited to web platforms
- May require additional setup for complex use cases
Use Cases
- Server monitoring dashboards
- Real-time analytics displays
- Live data feeds visualization
Smoothie Charts Pricing
Free Plan
No detailed pricing information available
User Reviews
3.0
out of 5
3.0
No reviews yet
Be the first to review this tool!