



NYC Taxi data
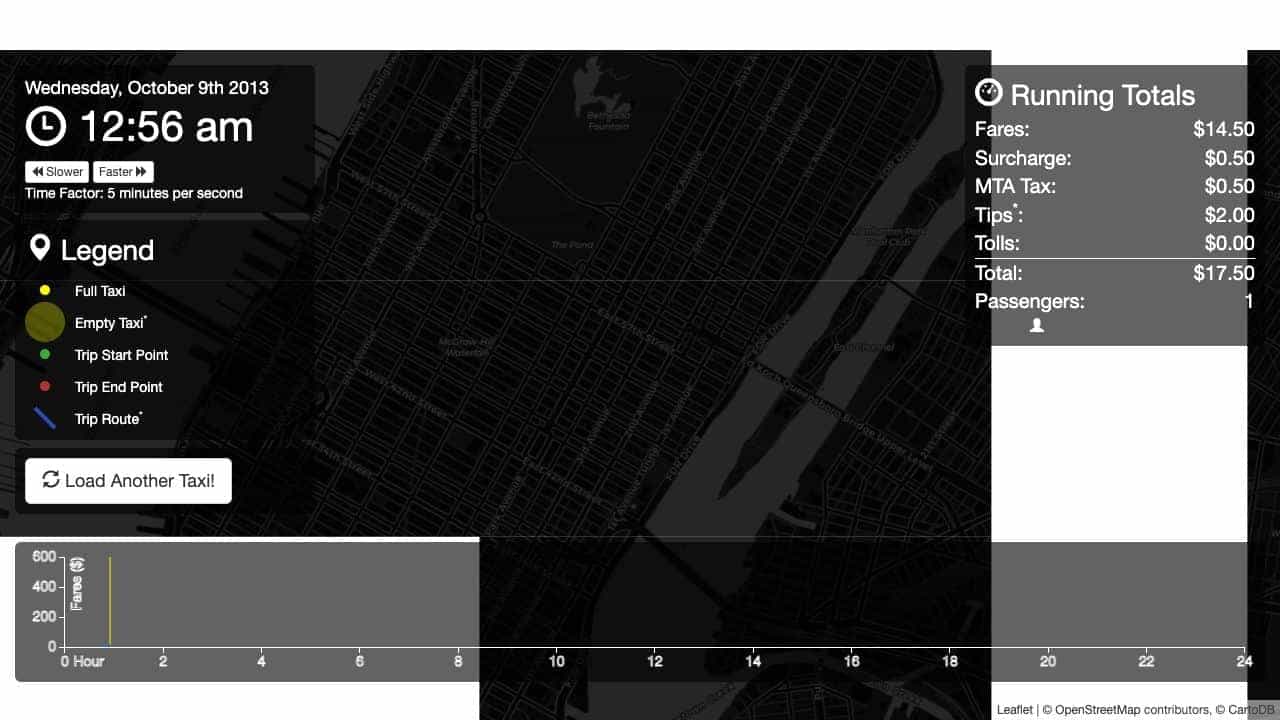
A data visualization showing one random NYC yellow taxi's day in 2013, including routes, fares, and activity over 24 hours.
Score
30
User Rating
3.0
Free/Trial Support
Supported
Starting Price
--
Last Updated
Apr 24, 2026
Overview
What is NYC Taxi data?
This civic technology project visualizes taxi trip data from 2013, displaying the activities of a single taxi on a single day. It uses data from the NYC Taxi and Limousine Commission and Google Directions API to create animated routes and running totals of fares, taxes, and tips.
What is NYC Taxi data used for?
Top Features
- Interactive map visualization
- Animated taxi routes
- Real-time fare and metric tracking
- Random taxi selection
- Open data integration
How to use NYC Taxi data?
Access the web visualization to view a random taxi's day, see animated routes on a map, track fares and other metrics over time, and load another taxi for comparison. No installation or account required.
Alternative Tools
No alternative tools found
Pros & Cons
Pros
- Free and open-source
- Educational for data visualization
- Engaging civic technology project
- Easy to use with no setup
Cons
- Limited to 2013 data
- Routes are approximations from Google API
- No customization options
- Only web-based
Use Cases
- Learning data visualization techniques
- Exploring NYC taxi patterns
- Civic hacking and open data projects
- Educational demonstrations
NYC Taxi data Pricing
Free Plan
No detailed pricing information available
User Reviews
3.0
out of 5
3.0
No reviews yet
Be the first to review this tool!