



morris.js
A simple JavaScript library for creating beautiful, interactive line, area, bar, and donut charts using jQuery and Raphaël.
Score
30
User Rating
3.0
Free/Trial Support
Supported
Starting Price
--
Last Updated
Aug 04, 2026
Overview
What is morris.js?
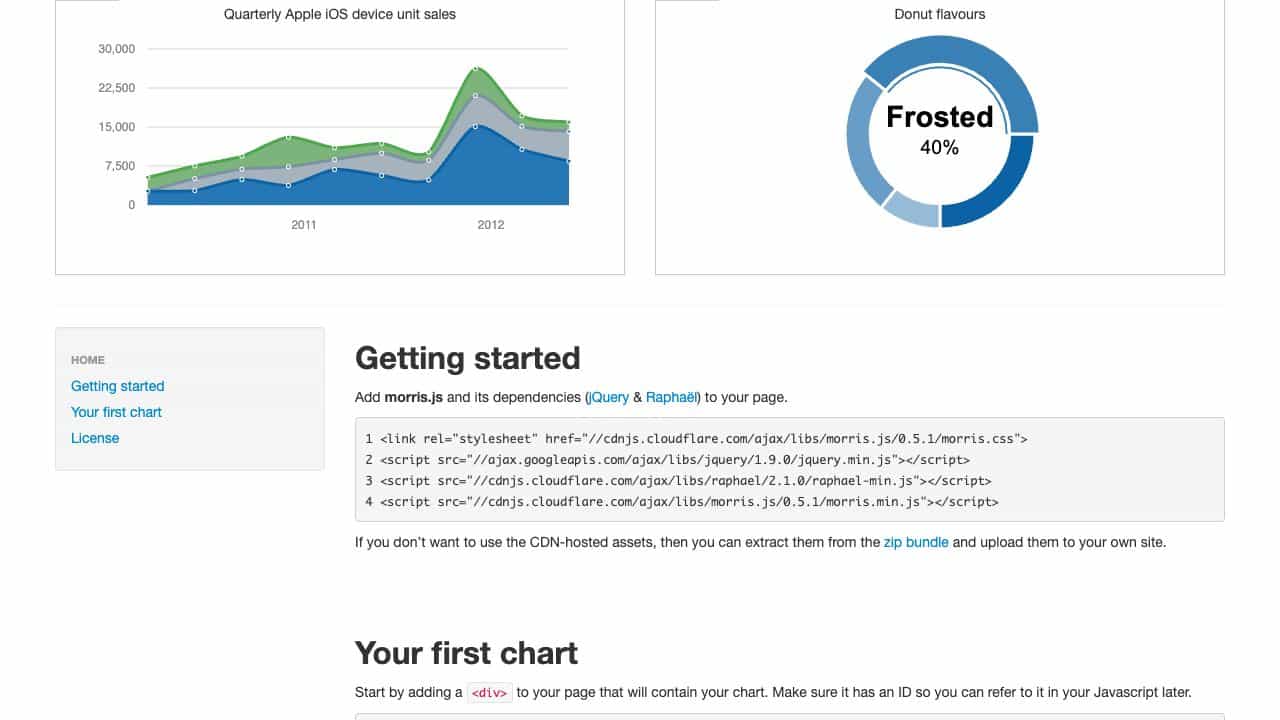
Morris.js is a lightweight, open-source JavaScript library that enables developers to easily integrate good-looking charts into web applications. It relies on jQuery and Raphaël for rendering and supports various chart types like line, area, bar, and donut charts with minimal setup.
What is morris.js used for?
Top Features
- Line charts
- Area charts
- Bar charts
- Donut charts
- Interactive hover effects
- Easy integration with jQuery and Raphaël
How to use morris.js?
To use Morris.js, include the necessary dependencies (jQuery, Raphaël, and Morris.js) via CDN or local files, add a div element with an ID and dimensions to your HTML, then initialize a chart with JavaScript by specifying data, x and y keys, and labels. It's designed for quick integration with customizable options.
Alternative Tools
No alternative tools found
Pros & Cons
Pros
- Lightweight and simple to use
- Open-source with BSD license
- Good-looking, responsive charts
- Supports multiple chart types
- Minimal code required for setup
Cons
- Depends on jQuery and Raphaël
- Limited advanced features compared to larger libraries
- No built-in support for real-time updates
Use Cases
- Web dashboards for data visualization
- Reporting tools in business applications
- Educational websites displaying statistical data
- Marketing analytics platforms
morris.js Pricing
Free Plan
No detailed pricing information available
User Reviews
3.0
out of 5
3.0
No reviews yet
Be the first to review this tool!