



echarts
Apache ECharts is an open-source JavaScript charting library for creating interactive, customizable data visualizations on the web.
Score
30
User Rating
3.0
Free/Trial Support
Supported
Starting Price
--
Last Updated
Aug 04, 2026
Overview
What is echarts?
Apache ECharts is a powerful, open-source charting and visualization library built with JavaScript. It supports a wide range of chart types including line, bar, pie, scatter, maps, 3D charts, and more, with features for data filtering, zooming, and rich interactivity. It is designed for web applications and integrates easily with various frameworks.
What is echarts used for?
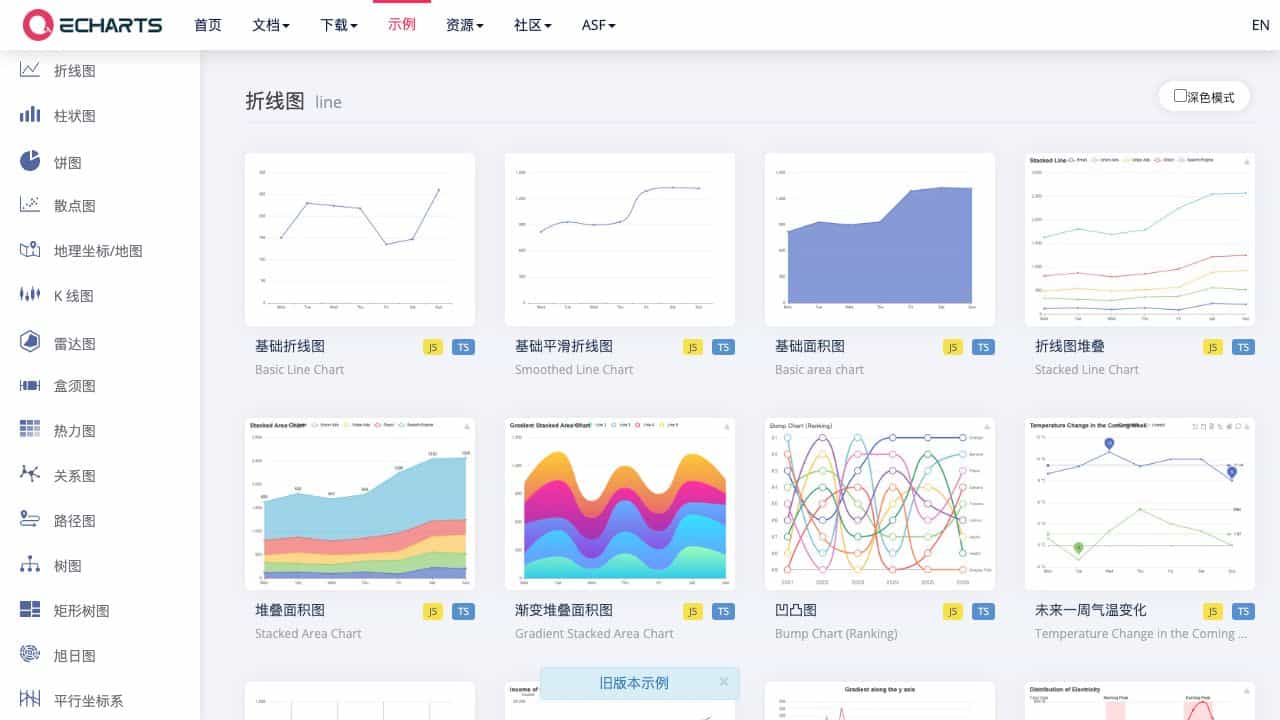
Top Features
- Wide range of chart types
- Interactive and customizable
- Supports 3D and geographic maps
- Data filtering and transformations
- Responsive design for mobile
- Open-source with active community
How to use echarts?
To use ECharts, include the library in your web project via CDN or npm, then initialize a chart instance with configuration options for data, chart type, and styling. You can customize charts extensively using its API and leverage features like datasets, data transformations, and interactive components for dynamic visualizations.
Alternative Tools
No alternative tools found
Pros & Cons
Pros
- Free and open-source
- Highly customizable with extensive API
- Good performance for large datasets
- Active development and community support
- Easy integration with web projects
Cons
- Steep learning curve for advanced features
- Primarily web-based, limited native platform support
- Documentation can be complex for beginners
Use Cases
- Data dashboards for business analytics
- Interactive reports in web applications
- Educational tools for data visualization
- Marketing and sales performance tracking
echarts Pricing
Free Plan
No detailed pricing information available
User Reviews
3.0
out of 5
3.0
No reviews yet
Be the first to review this tool!