



D3.js
D3.js is a JavaScript library for creating custom, dynamic data visualizations with high flexibility, used for charts, maps, and interactive graphs.
Score
30
User Rating
3.0
Free/Trial Support
Supported
Starting Price
--
Last Updated
Apr 24, 2026
Overview
What is D3.js?
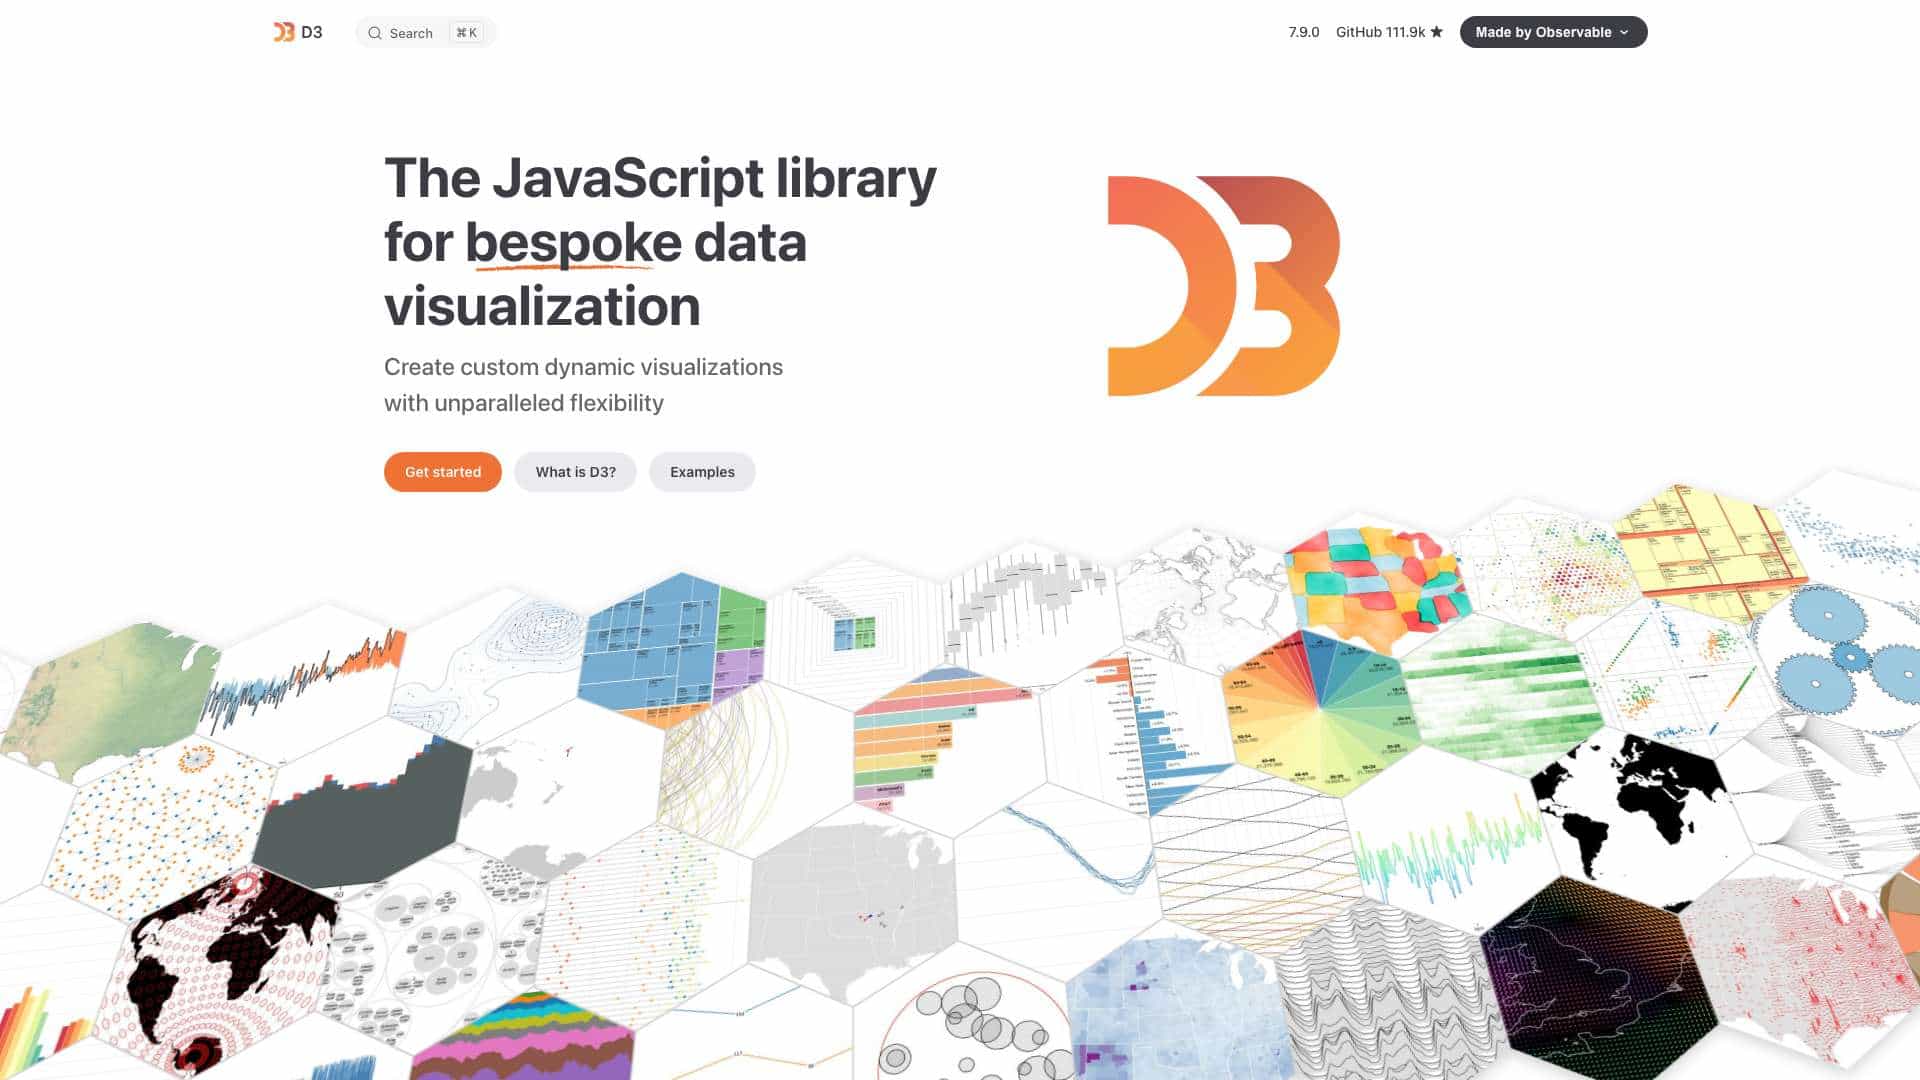
D3.js is a JavaScript library designed for bespoke data visualization, enabling developers to create custom dynamic visualizations with unparalleled flexibility. It provides tools for selections, transitions, scales, axes, shapes, interactions, layouts, and geographic maps, allowing for the creation of complex visualizations without the overhead of a virtual DOM.
What is D3.js used for?
Top Features
- Custom dynamic visualizations
- Selections and transitions
- Scales and axes
- Shapes rendering
- Interactive behaviors
- Layout algorithms
- Geographic maps
- CSV parsing
- Color spaces
- Statistics
How to use D3.js?
To use D3.js, include the library in your web project, then use its API to bind data to DOM elements, apply scales and axes, render shapes, add interactive behaviors like panning and zooming, and utilize layout algorithms for graphs and maps. It integrates with Observable for collaborative data analysis and supports live data connections.
Alternative Tools
No alternative tools found
Pros & Cons
Pros
- High flexibility and customizability
- Powerful for complex visualizations
- Large community and resources
- Free and open-source
- Integrates with Observable platform
Cons
- Steep learning curve
- Requires JavaScript expertise
- Can be verbose for simple charts
Use Cases
- Creating interactive data dashboards
- Building custom charts for reports
- Developing geographic map visualizations
- Implementing force-directed graphs for network analysis
- Educational data visualization projects
D3.js Pricing
Free PlanSubscription Plan
No detailed pricing information available
User Reviews
3.0
out of 5
3.0
No reviews yet
Be the first to review this tool!