



Chartkick
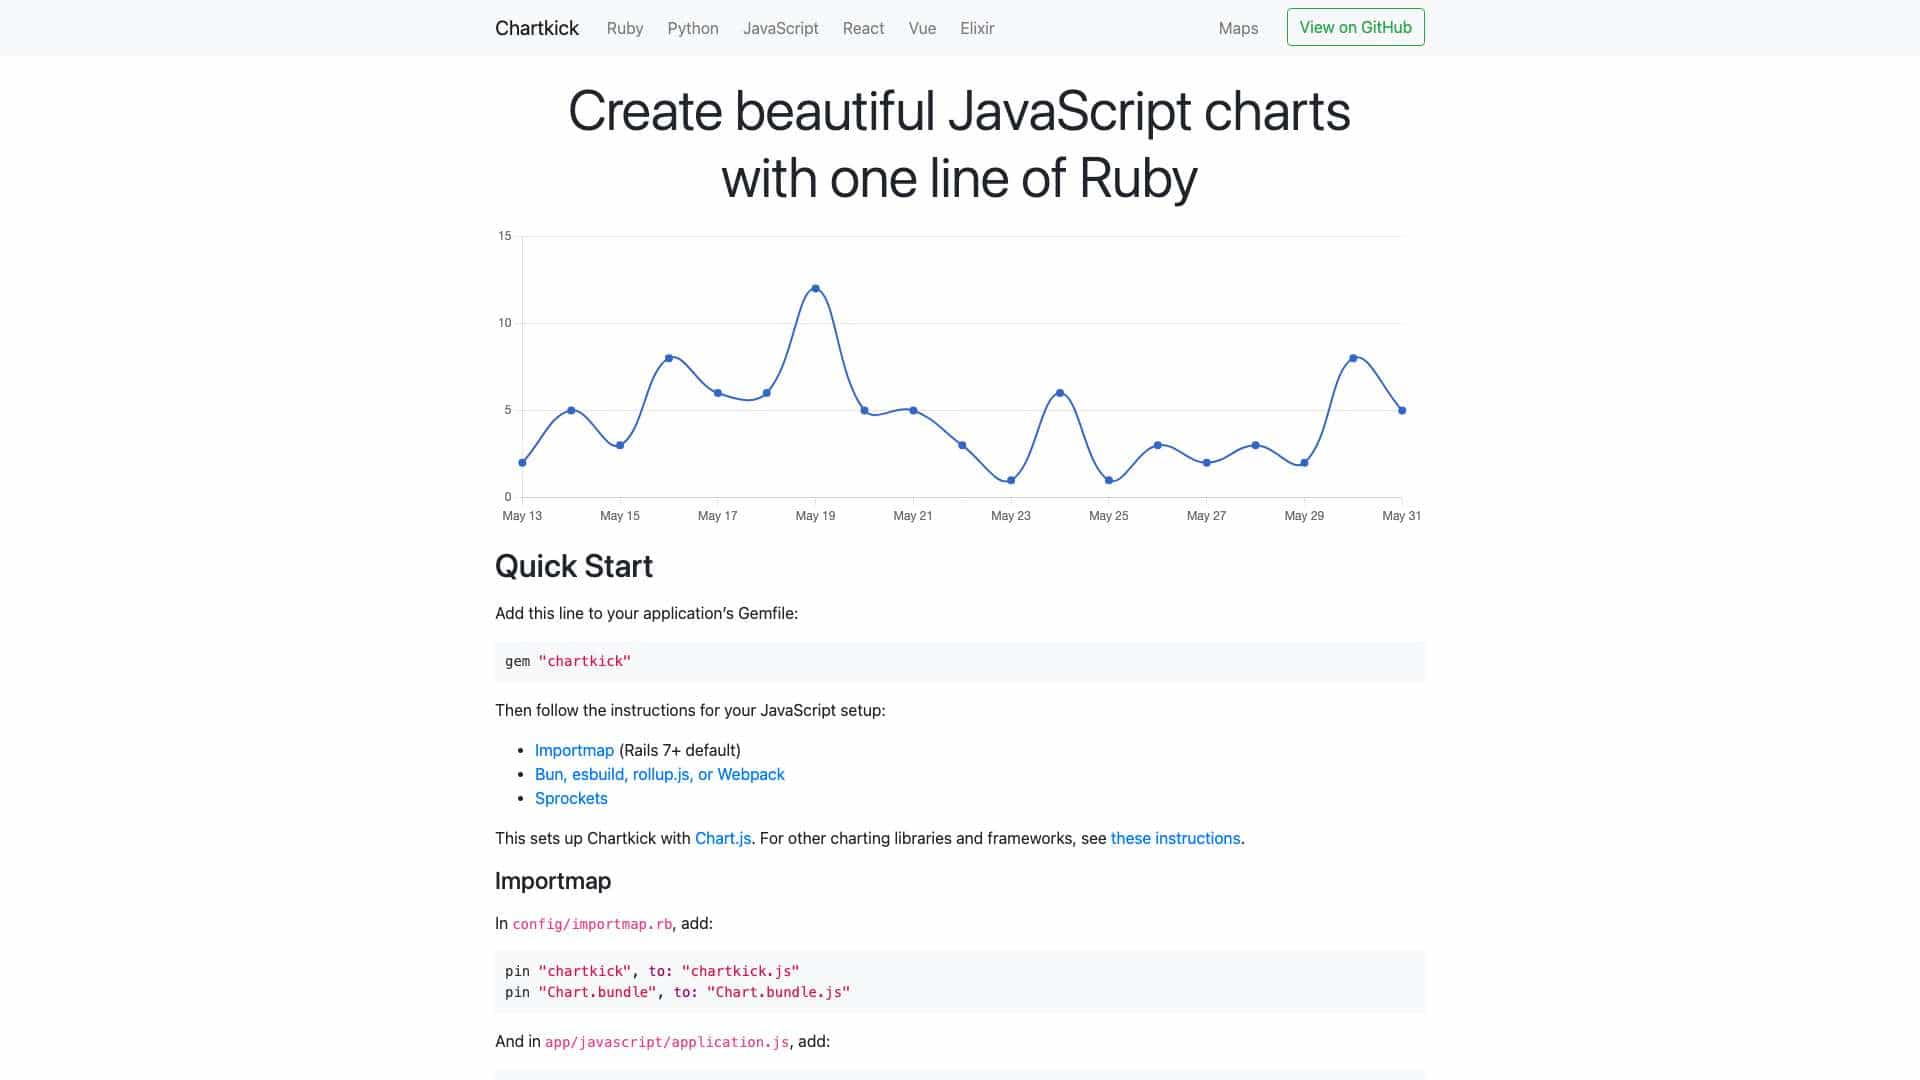
Create beautiful JavaScript charts with one line of Ruby, Python, or JavaScript code, supporting multiple frameworks and charting libraries.
Score
30
User Rating
3.0
Free/Trial Support
Supported
Starting Price
--
Last Updated
Apr 23, 2026
Overview
What is Chartkick?
Chartkick is a library that simplifies creating interactive charts for web applications. It works with Ruby, Python, JavaScript, React, Vue, and Elixir, integrating with Chart.js, Google Charts, and Highcharts to generate charts from data with minimal code.
What is Chartkick used for?
Top Features
- One-line chart creation
- Multiple chart types (line, pie, column, bar, area, scatter)
- Support for Chart.js, Google Charts, Highcharts
- Integration with Ruby on Rails, Python, JavaScript frameworks
- Customizable options (colors, axes, legends, downloads)
How to use Chartkick?
Install via gem, npm, or script inclusion, then use simple syntax like line_chart data to render charts. Configure options for styling, data sources, and interactivity, and set up with various JavaScript build tools or frameworks.
Alternative Tools
No alternative tools found
Pros & Cons
Pros
- Easy to use with minimal code
- Flexible with multiple charting libraries
- Good documentation and community support
- Fast rendering and performance optimizations
Cons
- Requires JavaScript setup and dependencies
- Limited to web-based deployments
- Advanced customization may need direct library access
Use Cases
- Data visualization in web apps
- Dashboard creation for analytics
- Reporting tools for business metrics
- Educational projects for charting
Chartkick Pricing
Free Plan
No detailed pricing information available
User Reviews
3.0
out of 5
3.0
No reviews yet
Be the first to review this tool!