



AMCharts
amCharts 5 is a comprehensive JavaScript charting library for creating interactive and animated data visualizations, including charts, maps, stock charts, and more.
Score
30
User Rating
3.0
Free/Trial Support
Not Supported
Starting Price
--
Last Updated
Aug 04, 2026
Overview
What is AMCharts?
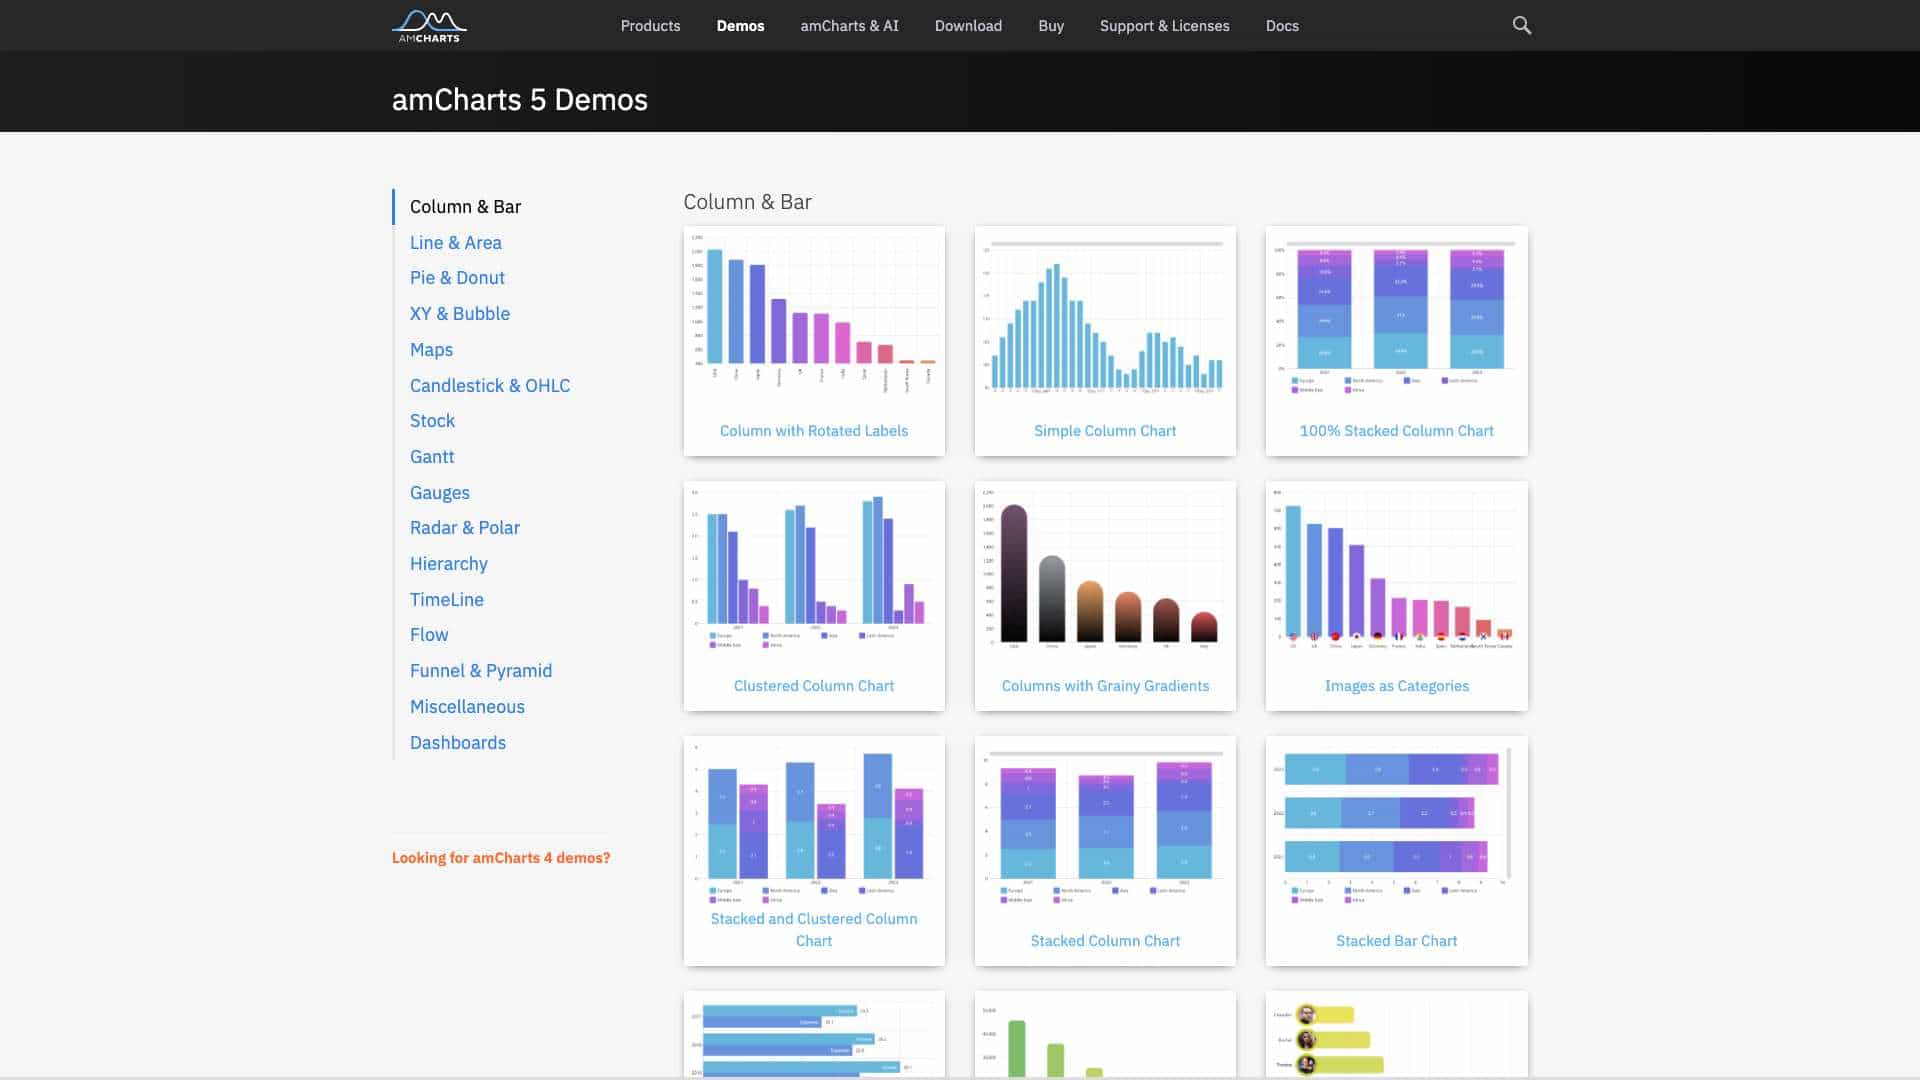
amCharts 5 is a modern JavaScript library for building a wide range of data visualizations such as column, line, pie, bubble, candlestick, Gantt, radar, and hierarchy charts, as well as maps and stock charts. It supports real-time data, animations, zooming, and drill-down capabilities, designed for developers and designers to integrate into web applications.
What is AMCharts used for?
Top Features
- Interactive charts and maps
- Real-time data support
- Zoom and drill-down functionality
- Animated visualizations
- Extensive customization options
- Wide range of chart types
- Mobile-responsive design
How to use AMCharts?
To use amCharts 5, include the library in your web project via CDN or download, then use JavaScript code to configure chart types, data sources, and styling options. It offers extensive demos and documentation for quick setup and customization.
Alternative Tools
No alternative tools found
Pros & Cons
Pros
- High customizability and flexibility
- Large variety of chart types and demos
- Good performance with large datasets
- Comprehensive documentation and support
Cons
- Steep learning curve for beginners
- Subscription-based pricing may be costly for small projects
Use Cases
- Financial dashboards and stock analysis
- Business intelligence and data reporting
- Educational tools for data visualization
- Marketing analytics and campaign tracking
AMCharts Pricing
Subscription Plan
No detailed pricing information available
User Reviews
3.0
out of 5
3.0
No reviews yet
Be the first to review this tool!