



中国区域图形数据
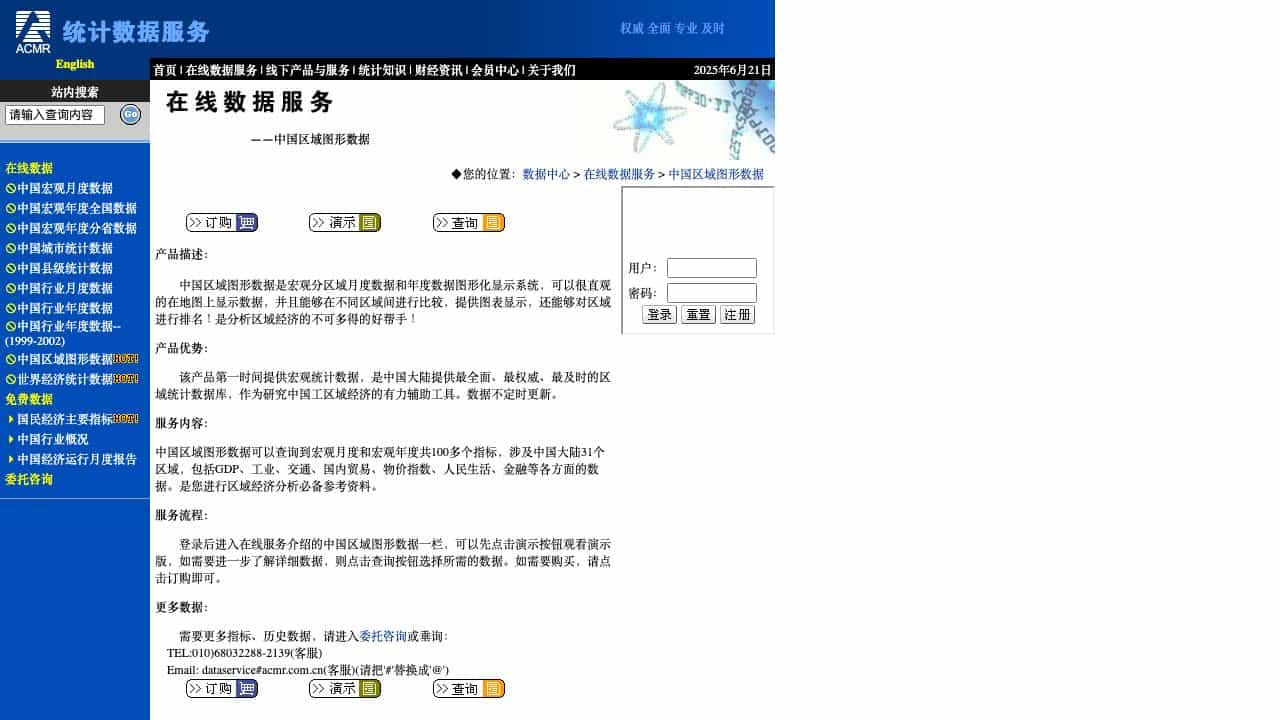
A graphical display system for China's regional macro monthly and annual data, enabling intuitive map visualization, comparisons, charts, and rankings for regional economic analysis.
Score
30
User Rating
3.0
Free/Trial Support
Supported
Starting Price
--
Last Updated
Sep 02, 2026
Overview
What is 中国区域图形数据?
China Regional Graphic Data is a system that visualizes macro monthly and annual data for China's 31 regions, including GDP, industry, transportation, trade, price indices, and more, with over 100 indicators for economic analysis.
What is 中国区域图形数据 used for?
Top Features
- Map-based data display
- Regional comparisons
- Chart visualization
- Ranking functionality
- Over 100 macro indicators
- Covers 31 Chinese regions
How to use 中国区域图形数据?
Log in, access the online service, watch a demo, query data by selecting indicators, and purchase if needed via ordering options.
Alternative Tools
No alternative tools found
Pros & Cons
Pros
- Comprehensive and authoritative data
- Timely updates
- Intuitive graphical interface
- Useful for regional economic research
Cons
- Limited customizability
- Requires login for full access
- Data updates may be irregular
Use Cases
- Regional economic analysis
- Academic research
- Business planning
- Policy development
中国区域图形数据 Pricing
Free PlanSubscription Plan
No detailed pricing information available
User Reviews
3.0
out of 5
3.0
No reviews yet
Be the first to review this tool!