
User Rating
3.0
Score
60
Free/Trial Support
Supported
Features
4 Features
Last Updated
Feb 05, 2026
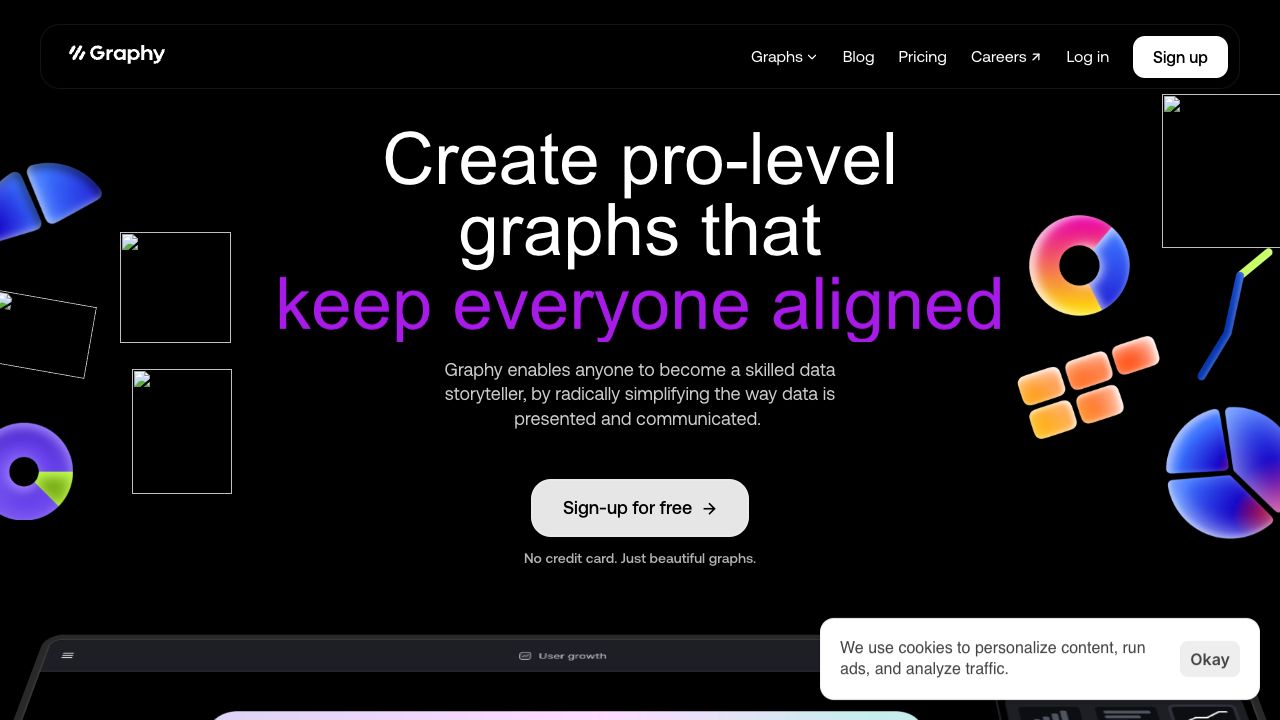
What is Graphy?
Graphy enables anyone to become a skilled data storyteller by radically simplifying the way data is presented and communicated. It allows users to create pro-level graphs that inspire actions, drive decisions, impress audiences, keep everyone aligned, and convince stakeholders. Trusted by 100,000+ users, Graphy offers AI-generated insights and graphs, connecting to Google Sheets and other data sources. It's built for modern teams, offering lightning-fast data visualization and easy-to-use interfaces.
How to use Graphy?
Users can add their data to Graphy, and the AI will create a chart and explain key insights. Graphs can be presented in slides or pasted into Slack. Data can be connected from Google Sheets or pasted from anywhere.
Top Features
- AI-generated insights and graphs
- Connects to Google Sheets and other data sources
- Lightning-fast data visualization
- Simple and intuitive interface
- Interactive and shareable graphs
- Visual annotations and enhancements
Pros & Cons
No Data
Use Cases
- Creating marketing reports
- Driving decisions with data
- Internal reporting and board memos
- Quickly creating visuals for newsletters and social feeds
- Consulting business presentations
User Groups
No Data
Graphy Pricing
Free PlanSubscription Plan
No detailed pricing information available
Cover Preview
GRAPHY Features
- AI Charting functionalityAI Charting
- AI For Data Analytics functionalityAI For Data Analytics
- AI Report Generator functionalityAI Report Generator
- Graph AI functionalityGraph AI